Guide to Page Speed Metrics after the Lighthouse Update

When it comes to SEO and page ranking, different optimisations such as faster load times, quicker responses, on-page optimisation, relevant backlinks, mobile-friendly and secure interfaces, are all very important. However, in the past couple of years, Google has been paying more and more attention to enhancing the user experience in particular. Just last year, in January 2018, Google came up with their Mobile-first indexing technique, essentially focussing on providing an optimal experience to smartphone users.
The Need to Create a Better WEB Experience
As per reports, over 53% of smartphone users leave a page if it takes more than 3 seconds to load. Thereafter, for every 1 second delay, the site loses 10% of it users. Needless to say, focussing on page speed optimisations is paramount in ensuring a smooth user experience. Google’s Mobile-first indexing, a milestone in the world of web, involves bots crawling the mobile interface first, and then moving on to the desktop interface of a site. As such, if a website doesn’t support a mobile module, it may rank relatively lower than its counterparts.
You may read our detail guide on Mobile First Indexing
What is Google Lighthouse?
With an intension to build a better web, Google recently came up with a new update to its PageSpeed Insights tool with Lighthouse. SEO experts and developers would know that Google API previously offered a couple of optimisation tools including TestMySite, and Lighthouse among others. While all these tools analysed pages with their own parameters, they often created confusion by giving different results and solutions. Lighthouse, an opensource automated tool, which provides the Page performance along with other metrics like PWA, SEO, & other best practices.
Here is a guide that explains how Lighthouse calculates the scores
No one tool could provide a complete summary of a page audit with all ranking factors.
However, Google’s latest Page Speed update combines the benefits of Lighthouse by integrating it into the PageSpeed Insights tool. This means that you could just run one diagnostic test and get a complete performance matrix with a detailed, concise report.
What Does the NEW PSI Provide?
The Lighthouse update is creating ripples in the SEO industry as Google has completely revamped the tool to focus solely on optimum user experience. Spanning all actions from the time a user lands on a page till he leaves, there’s a performance index to measure all actions and events. Based on the RAIL (Response, Animation, Idle, Load) performance model, the tool generates a detailed report with new improvised metrics.
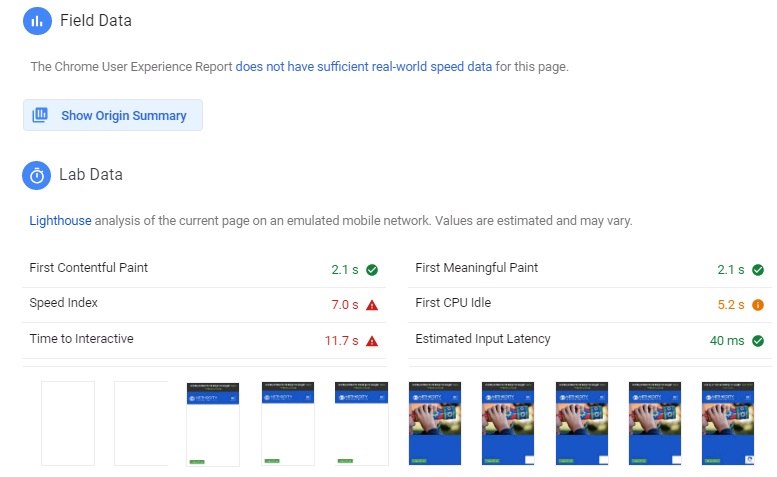
The report is majorly divided into 2 sections, vis. the Lab data and the Field data. While the lab data focuses on all the optimisation metrics at the back end, the field data uses the Chrome User Experience Report (CrUX) to record real-time user experience and collect data. The tool measures real-world metrics. Together, both these reports provide a succinct idea about where your website stands in terms of its contemporaries, and also provides you with possible solutions to increase your page ranking. Let’s have a look at the list of performance metrics that form a part of the Lighthouse update.
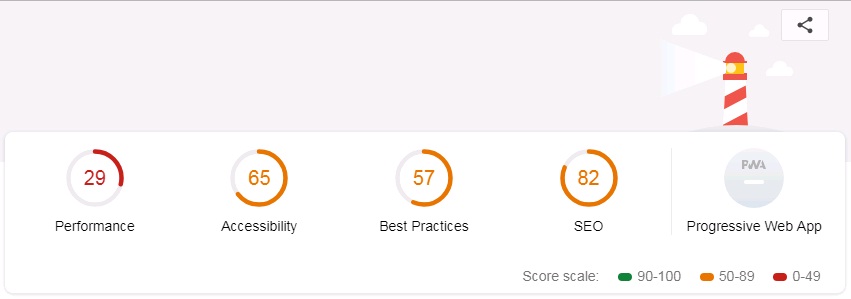
Lab Data – These are the standard metrics that measure page speed and responsiveness in a controlled environment. The tool basically simulates an average mid-range smartphone with a 3G/4G connection, to test the performance of a site. A good score(90-100) is shown with a green tick, and an average score(50-89) with an orange circle, whereas a poor score(0-49) is shown with a red triangle. These metrics are as follows:
- First Contentful Paint (FCP)– As the name suggests, this describes the time taken for the page to load the first basic pixels of content, or in other words, for the page to give its first response to the user.
- First Meaningful Paint (FMP)– Every page has some primary content which is the centre of attraction or the hero element of the page. FMP describes the time taken for the primary content element to load on the screen. This is a key metric as it holds the attention of the user on the screen. The lower this value, the faster the page loads.
- Speed Index –This metric measures the average speed at which the entire content of the page gets loaded onto the screen. It basically checks how quickly all the visible elements on the screen are loaded.
- First CPU Idle –Previously known as First Interactive, this page measures the time taken for a page to become minimally interactive. This includes 2 things:
- It is the minimum time required for most of the components, maybe not all, to be interactive and responsive.
- It is also the minimum time after which the page responds to user input in a reasonable time.
- Time To Interactive –As the name suggests, this metric measures the time for the page to become interactive, i.e. all its useful content has been successfully loaded, and the page is responsive. Naturally, the lower this score, the better.
- Input Latency –This describes the time taken by the page to respond to a user input. Statistics show that within apps, any lag of more than 100ms is enough to make a user leave the page. As such, to score well on this metric, the input latency or user input response time should stay within 50ms.
Field Data – It is not just enough to lab test your website on its performance factors, it is equally necessary to get an idea of how your web page works in the real world. Using CrUX reports from the chrome browser, the Google API delineates the average loading speed of your page in the past 30 days. It gives a detailed report of how various pages of your site have performed under different internet speeds.
How to Speed Up Page Load Times with the New Google’s PageSpeed Insights Reports?
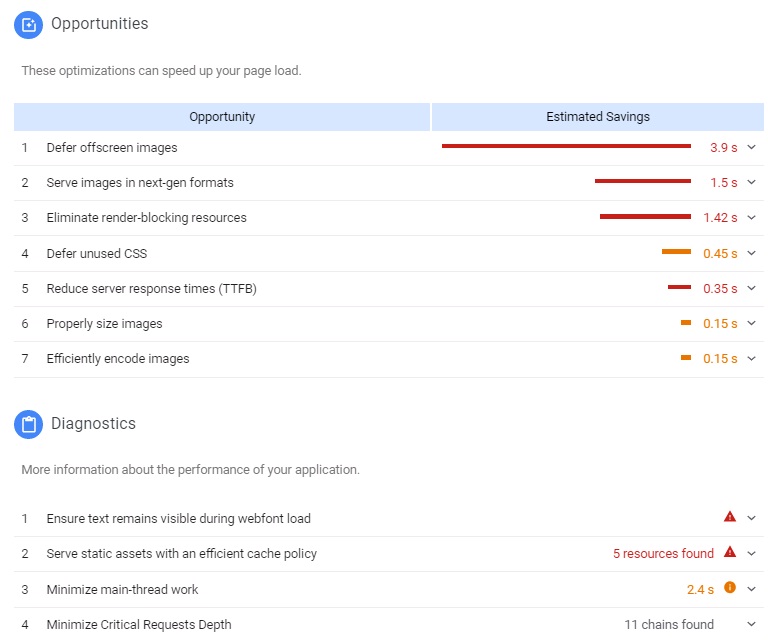
The new Google Page Speed Insight report also includes an opportunities and diagnostics section. The opportunities section deals with solutions and methods to improve the performance of the page. It also shows statistics of how the suggested changes would positively affect the page speed. Diagnostics, on the other hand, is a complete report and graph of the page’s performance, and also includes a total audit report outlining the key performance factors and suggesting various counter measures.
Google’s Lighthouse update is a thorough, detailed, feasible solution to track the activity of your page and improve its performance. Bearing in mind how much Google stresses on smooth user experience, it will be conducive for the developers and SEO web masters to take the results of these metrics into account while optimising the web pages.
Know more about how Lighthouse works and you can also have it integrated as a browser extension to improve your web performance.
For more information on how site speed can affect your SEO performance and how you can improve the score, contact our team today.